
Definition
Also known as the Cause and Effect Diagram and the Fishbone Diagram because of its fish-like shape, the Ishikawa diagram is a tool used for structured brainstorming for potential causes of a problem. The effect (or problem) is placed at the "head" of the fish and the bones are labeled with categories of possible causes.
Examples
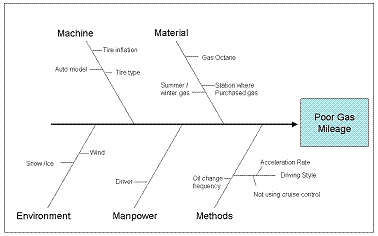
In this example, a group was asked to brainstorm causes of poor gas mileage. In this case the "4 M's and E" were used for the cause categories. The next step is for the facilitator to help the group rank the potential causes brainstormed here.
Application
Manufacturing commonly uses the "4 M's and E" as the categories, while service organizations sometimes prefer to use the "4 P's".
The 4 M's and E are:
Manpower Methods Machine Material EnvironmentThe 4-P's are:
People Process / Plant Procedure PoliciesThe team leader may choose to make up his or her own categories. The purpose of using categories is to provide team members with a mental framework to help them look beyond the usual suspects for potential causes.
External Links
Skymark.com - Cause and Effect Tool - http://www.skymark.com/resources/tools/cause.asp American Society for Quality (ASQ) - Fishbone - http://www.asq.org/learn-about-quality/cause-analysis-tools/overview/fishbone.html Moresteam.com's Toolbox - Cause and Effect Diagram - http://www.moresteam.com/toolbox/fishbone-diagram.cfm